

Engagement
Track engagement across messages, reactions, app interactions and voice, with your busiest channels, hours and members.
Engagement, at Server Analytics → Engagement, shows how many of your members take part and how. It has five tabs: Messages, Reactions, App interactions, Announcements and Voice. Announcements is its own page, shown as a tab here: see Announcements. The other four follow the range, channel and role controls in the header.
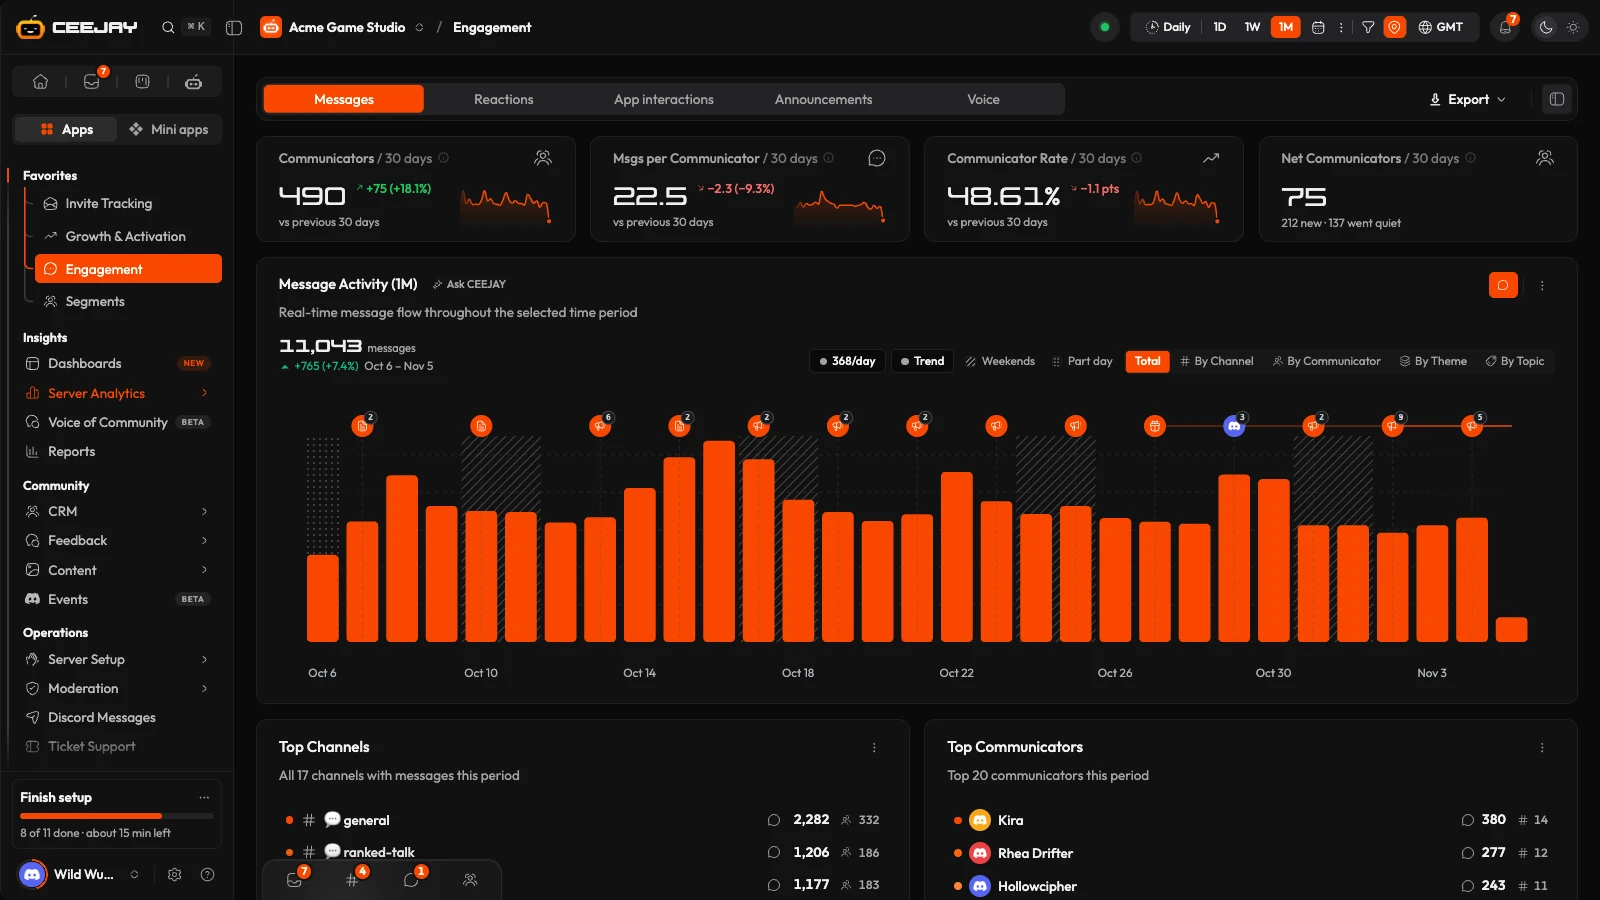
Messages
The four cards
On this page a communicator is a member who sent at least one message in the period. It is the same idea as Communicators on Home.
| Card | What it counts |
|---|---|
| Communicators | Members who sent at least one message in the period. The change shows as a number of members ("+12") and only becomes a percentage once the earlier period had 20 or more. |
| Msgs per Communicator | Messages divided by communicators. Press the (i) to see both totals. |
| Communicator Rate | Communicators as a share of your members. The earlier period is divided by its own member count, so the change is in percentage points. |
| Net Communicators | New communicators minus communicators who went quiet. The line under the number gives both counts, for example "40 new · 28 went quiet". Went quiet means they posted last period and not this one. They may well still be in the server. There is no chart on this card. On ALL it shows a dash, because there is no earlier period. |
If the numbers cannot load, the cards show a dash and Retry appears under them.
Message Activity
Messages over time, titled with the range, for example Message Activity (1W). The figure at the top is the message total and its change against the period before.
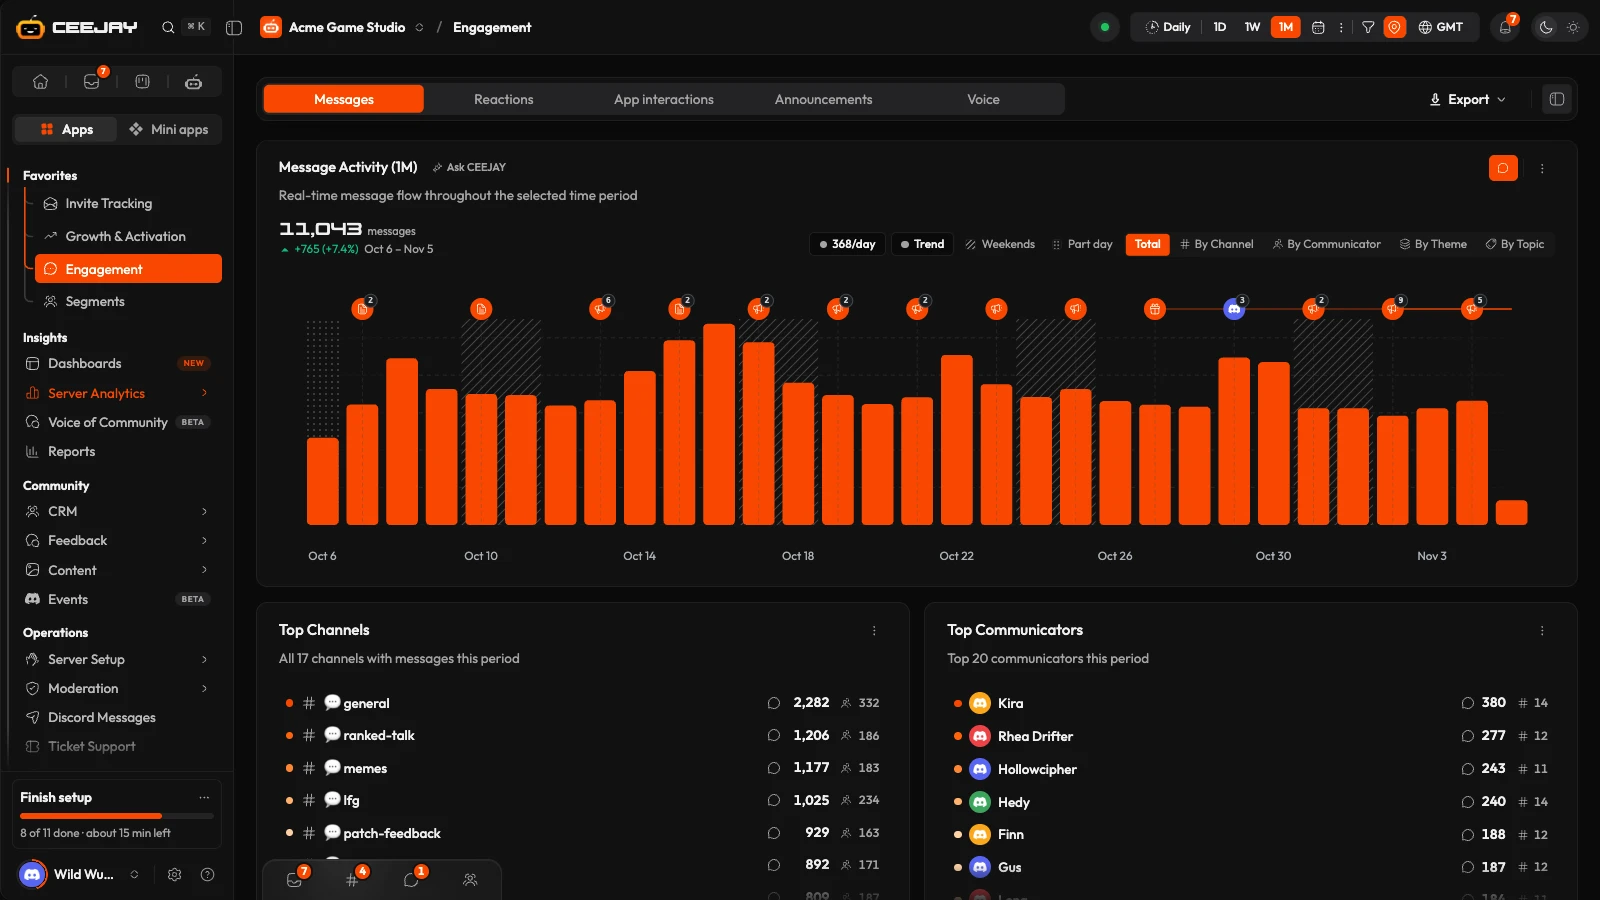
- Total shows one bar or line for all messages. By Channel, By Communicator, By Theme and By Topic stack the bars by channel, by member, by the Voice of Community theme or by topic. A view is greyed out when the range has nothing to split.
- The average button (it reads a number, such as 360/day) and Trend overlay an average line and a trend line. They work in the Total view of the bar chart.
- The Ask CEEJAY button beside the title asks the assistant to look for unusual patterns in this data.
- The chart's ⋯ menu has Show values and the export options. Drag across the chart to select a date range, and right-click a point to comment on it. Range, filters and export shows how.
What else is on the tab
- Top Channels and Top Communicators: ranked by messages. The ⋯ menu's Max Items shows 5, 10, 15 or 20, and View all opens a longer list. Press a channel to open its side panel with its busiest hours and the members behind it.
- Message Engagement Tiers: a donut of the members who posted, by how many messages they sent.
- Message Heatmap: messages by day of the week and hour, with Peak Activity, Best Hours and Best Days, in the timezone chosen in the header. The busiest hours stand out even in a week with one spike.
Reactions
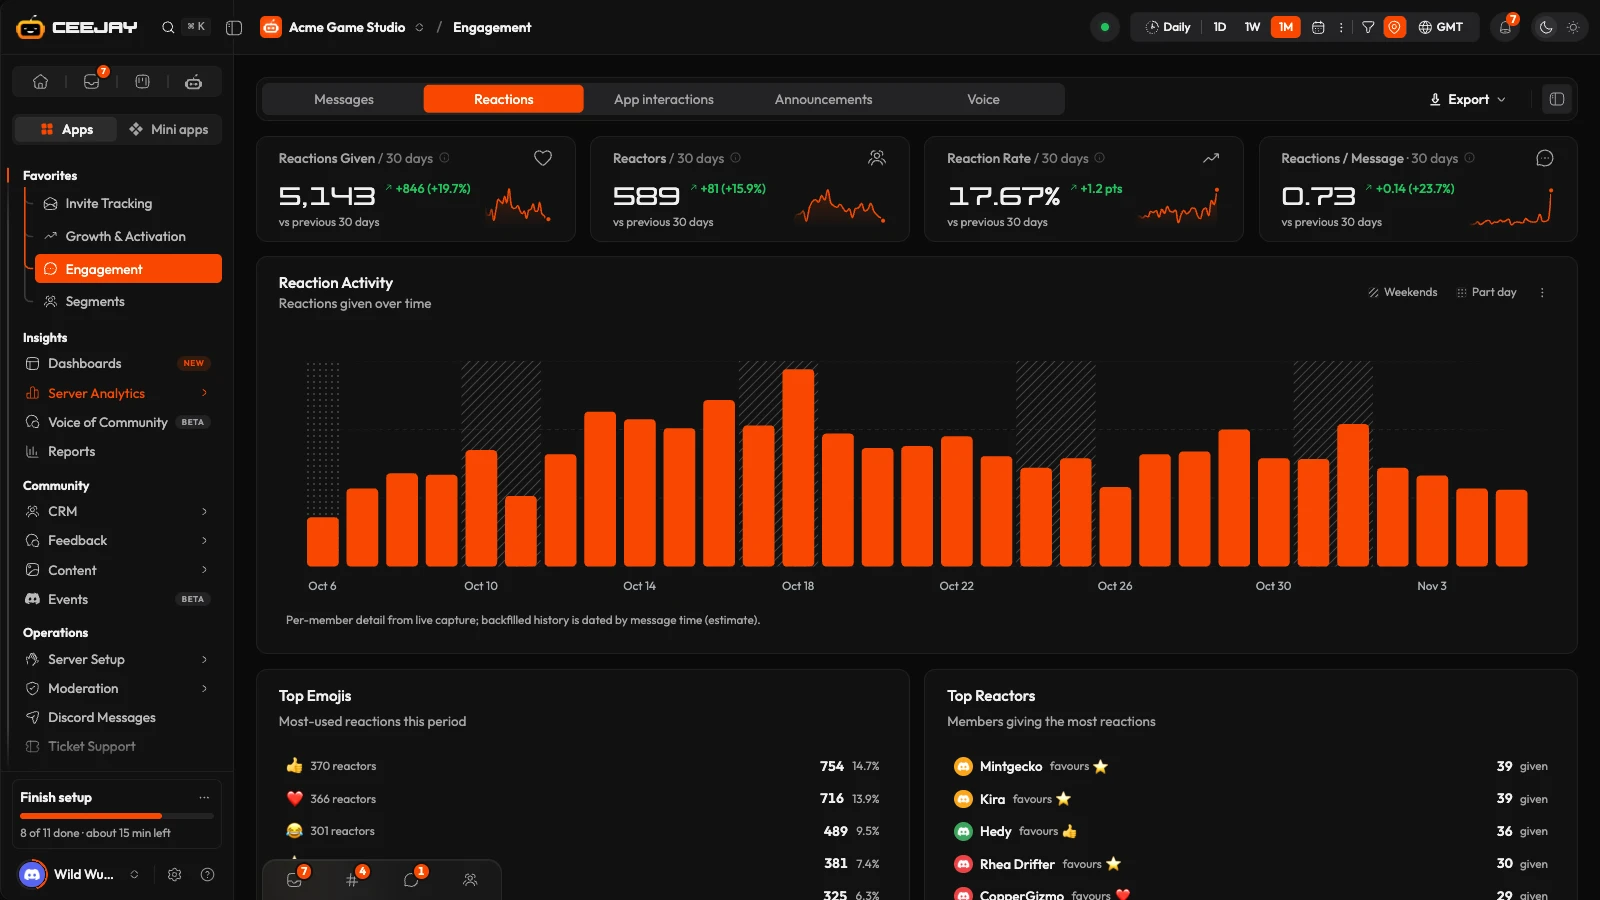
Reactions covers the reactions members add to messages:
- Reactions Given, Reactors, Reaction Rate (the share of messages that earned at least one reaction) and Reactions / Message.
- Reaction Activity over time. With comparison switched on in the header, the previous period is drawn as well.
- Top Emojis, Top Reactors, Most Loved Members (reactions received) and Most Reacted Messages, each with a View in Discord link.
Good to know
Reactions Given counts reactions members added during the period, on any message, old or new. Reaction Rate and Reactions / Message look at the messages sent in the period and the reactions those earned, so they do not always move together with Reactions Given.
App interactions
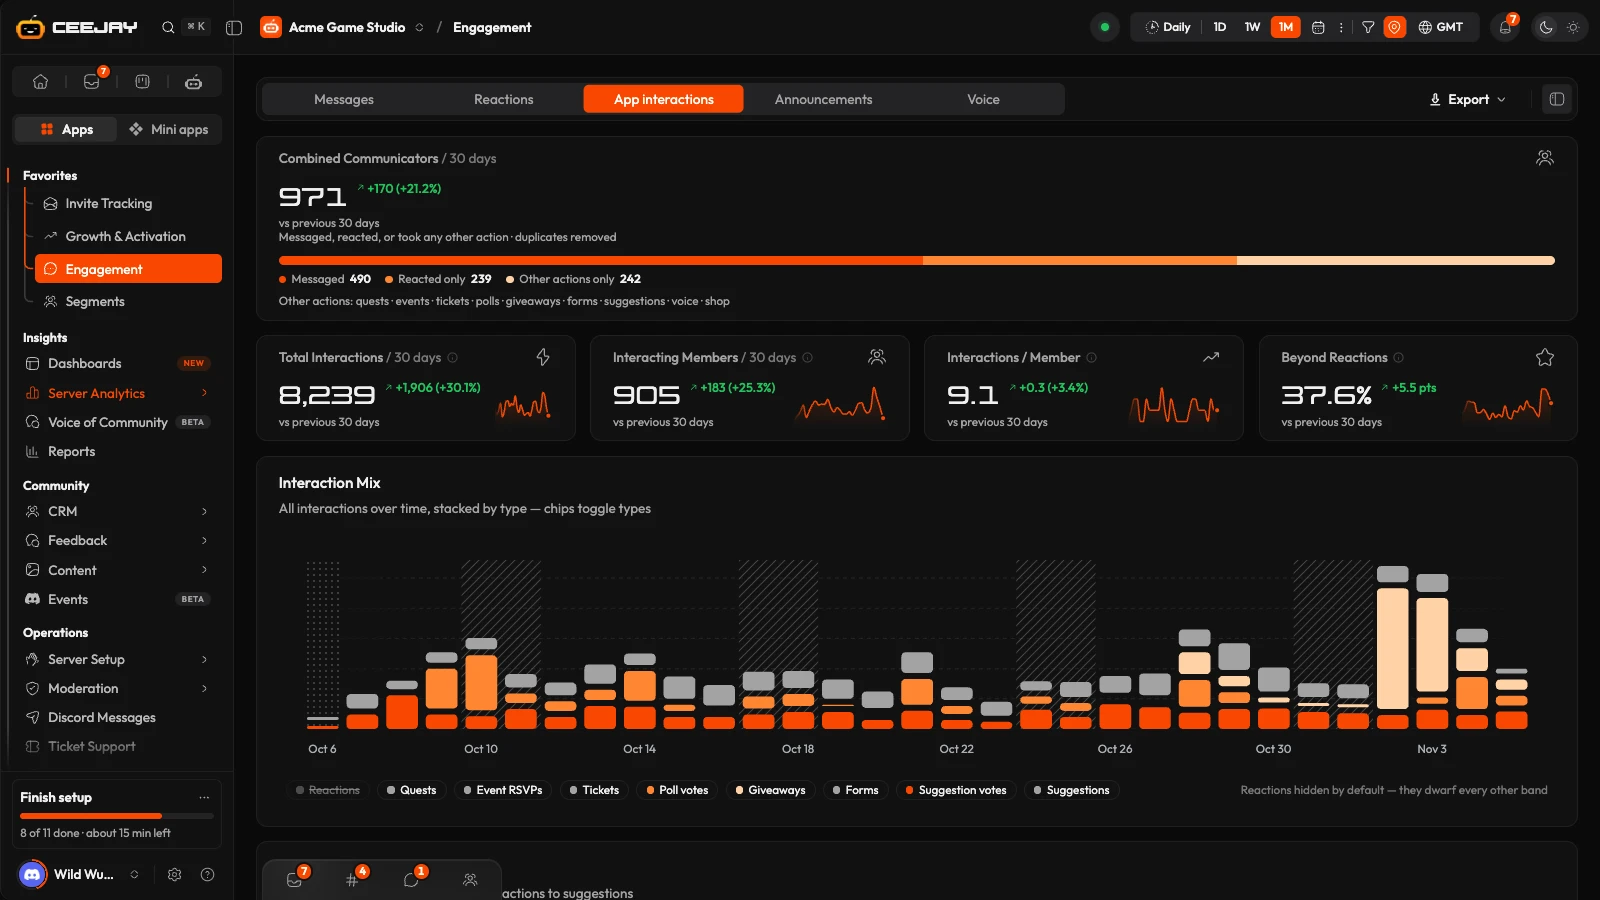
App interactions counts what members do in CEEJAY's tools besides writing in channels: quests, event RSVPs, tickets, poll votes, giveaway entries, form responses, suggestions and suggestion votes.
- Combined Communicators is the number of different members who messaged, reacted or did anything else, each counted once. A bar splits them into Messaged, Reacted only and Other actions only.
- Total Interactions, Interacting Members, Interactions / Member and Beyond Reactions (the share of interactions that are not reactions).
- Interaction Mix stacks every interaction over time by type. The chips under the chart switch types on and off. Reactions start switched off, because there are far more of them than anything else.
- By Type lists every type with its count and change. A type with no activity reads "none yet".
- Most Active Interactors ranks members by their total interactions across all types, with their top three types beside each name.
Voice
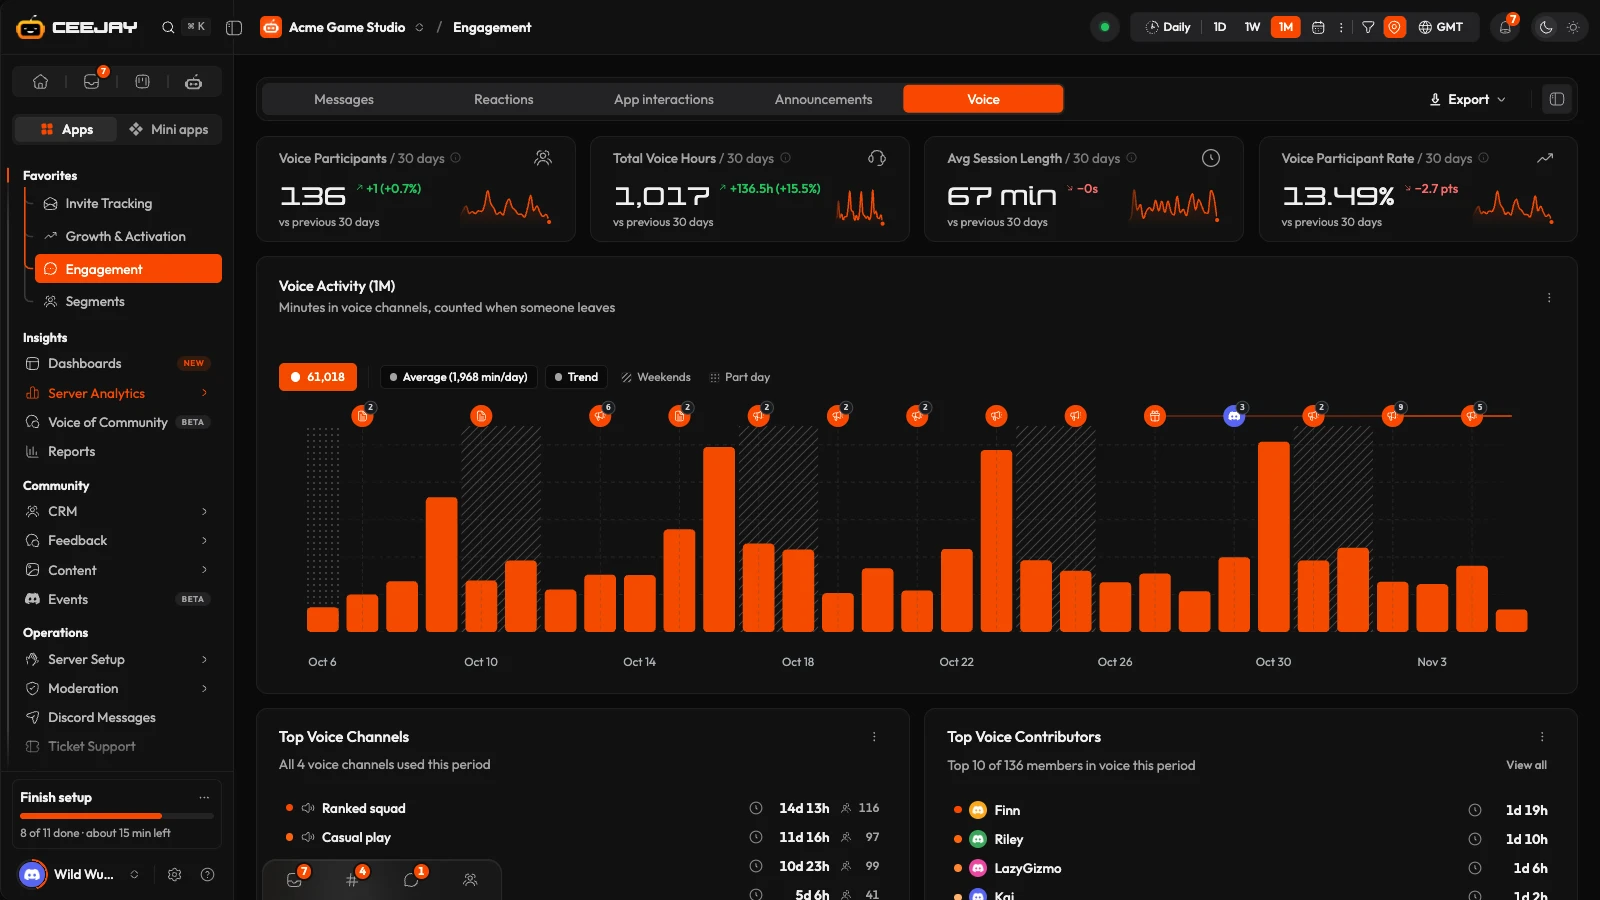
| Card | What it counts |
|---|---|
| Voice Participants | Different members who joined a voice channel in the period. |
| Total Voice Hours | Time spent in voice channels, in hours. The (i) gives the same total in minutes. |
| Avg Session Length | The average length of a voice session, in minutes. Longer is better here, so a rise shows in green. |
| Voice Participant Rate | Voice participants as a share of your members, with the change in points. |
Below the cards are the Voice Activity chart, Top Voice Channels and Top Voice Contributors, both ranked by voice minutes.

