

Range, filters and export
Choose the period, channels, roles and timezone an analytics page shows, compare with an earlier period, and take the data out as CSV or PDF.
The header holds the controls that apply to the whole page you are on: the community and page name, the Live dot, the date range group, the bell and the light and dark switch. Pick a period there and the numbers and charts on the page follow it. Each page also has its own bar under the header, with its tabs, Export and Settings.
What you see
From left to right in the header:
- The Live dot. Its tooltip gives the status in words, and pressing it opens the Live updates panel.
- The chart interval button, which shows the current choice: how charts are grouped in time (Hourly, Daily, Weekly or Monthly). Short ranges offer fewer choices.
- 1D, 1W and 1M: the last 24 hours, 7 days and 30 days.
- A calendar icon for custom dates.
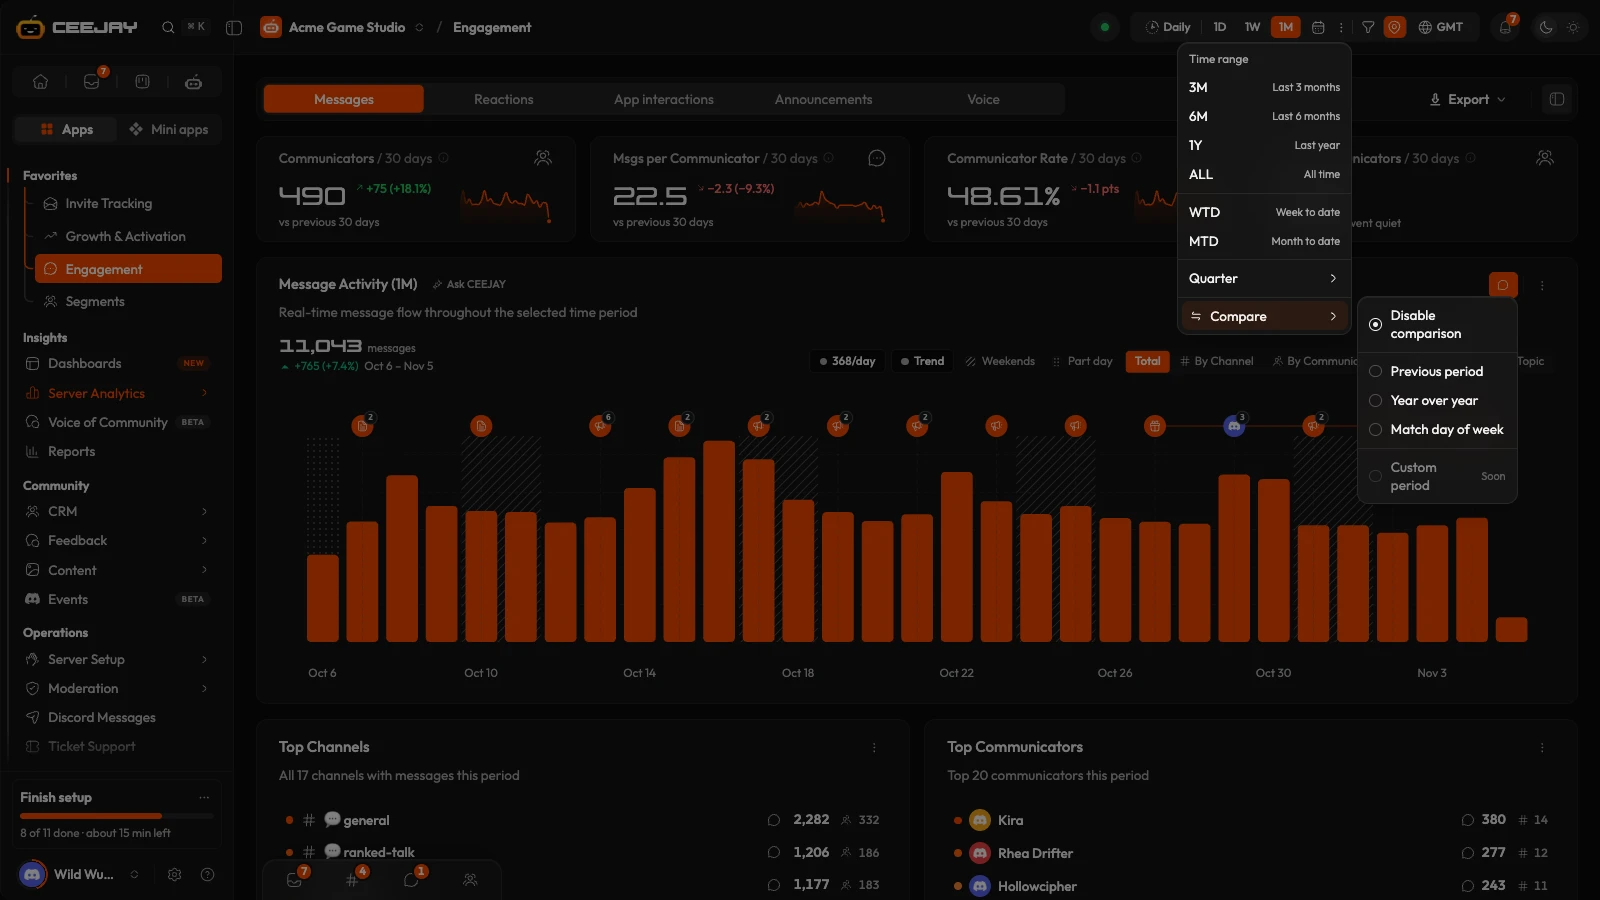
- A ⋮ menu (More date ranges) with 3M, 6M, 1Y and ALL, WTD (week to date, from Monday) and MTD (month to date, from the 1st), Quarter, and Compare.
- A funnel icon (Filters) for channels and roles.
- A map pin (Event markers).
- The timezone, shown by its abbreviation.
Not every page has every control. The table shows what to expect.
| Page | Range and compare | Channel and role filters | Export menu |
|---|---|---|---|
| Growth & Activation, Engagement, Voice of Community, Announcements | Yes | Yes | Yes |
| Roles & Channels, Demographics, Activity | Yes | No | Yes |
| Account Linking | Yes, on Overview and Impact | No | No |
| Home, ROI | No (Home is always the last 7 days, ROI the latest daily run) | No | No |
| Members, Segments, Programs, Email | No | No | No |
Choose a period
Press 1D, 1W or 1M.
For anything else, open the ⋮ menu and pick 3M, 6M, 1Y or ALL, WTD or MTD, or pick Quarter and then a year and Q1 to Q4.
For exact dates, press the calendar icon, choose a first and a last day on the calendar, then press Apply Range. Remove clears a saved custom range. Days after today cannot be picked.
Pages open on 1W, the last 7 days. On a narrower window the quick ranges fold into one menu that shows the current range. On a phone the range sits in a menu under the page title, next to a Filters button that opens everything else in one panel.
Good to know
Stat cards say which period they cover, for example "Members Joined / 7 days", and what they are compared with. A page that cannot follow the range says so on the page, such as "latest" on the ROI cards, or "last 7 days" on Home. Retention on Growth & Activation reads at least 3 months and says so above its cards.
Compare with an earlier period
Stat cards already show the change against the period before. Compare adds the earlier period to charts that support it. The earlier period is drawn as a solid, muted line, not a dashed one, because dashes are kept for averages, trends and forecasts. The tooltip then shows both dates. On the analytics pages the charts that draw it are Server Growth, Message Activity, New Member Activity and, for Previous period only, Reaction Activity. The other analytics charts ignore the setting. Some pages outside Server Analytics, such as the Rewards overviews, Events and Account Linking, follow it too.
Open ⋮ → Compare and pick one:
- Previous period: the same length straight before the current one.
- Year over year: the same dates one year earlier.
- Match day of week: an earlier period shifted back by whole weeks, so weekdays line up.
- Disable comparison: back to one period.
Custom period is marked Soon. There is no comparison on ALL, because nothing comes before it.
Filter by channel and role
Press the funnel icon (Filters). The panel lists Channels, Roles and Segments, each with a count.
Open Channels or Roles and tick what you want to keep. Each list has a search box and All and None buttons, and Select All and Clear All at the top of the panel act on both lists. Inside Channels you can also tick a whole category at once.
Press Apply Filter. Reset beside it goes back to everything. Once a filter is applied the panel says Filters applied in their place. To clear it later, press Select All and then Apply Filter. With nothing filtered the panel says All data shown. Save View at the foot of the panel keeps the filter you have set under a name, and saved views are listed there to apply again.
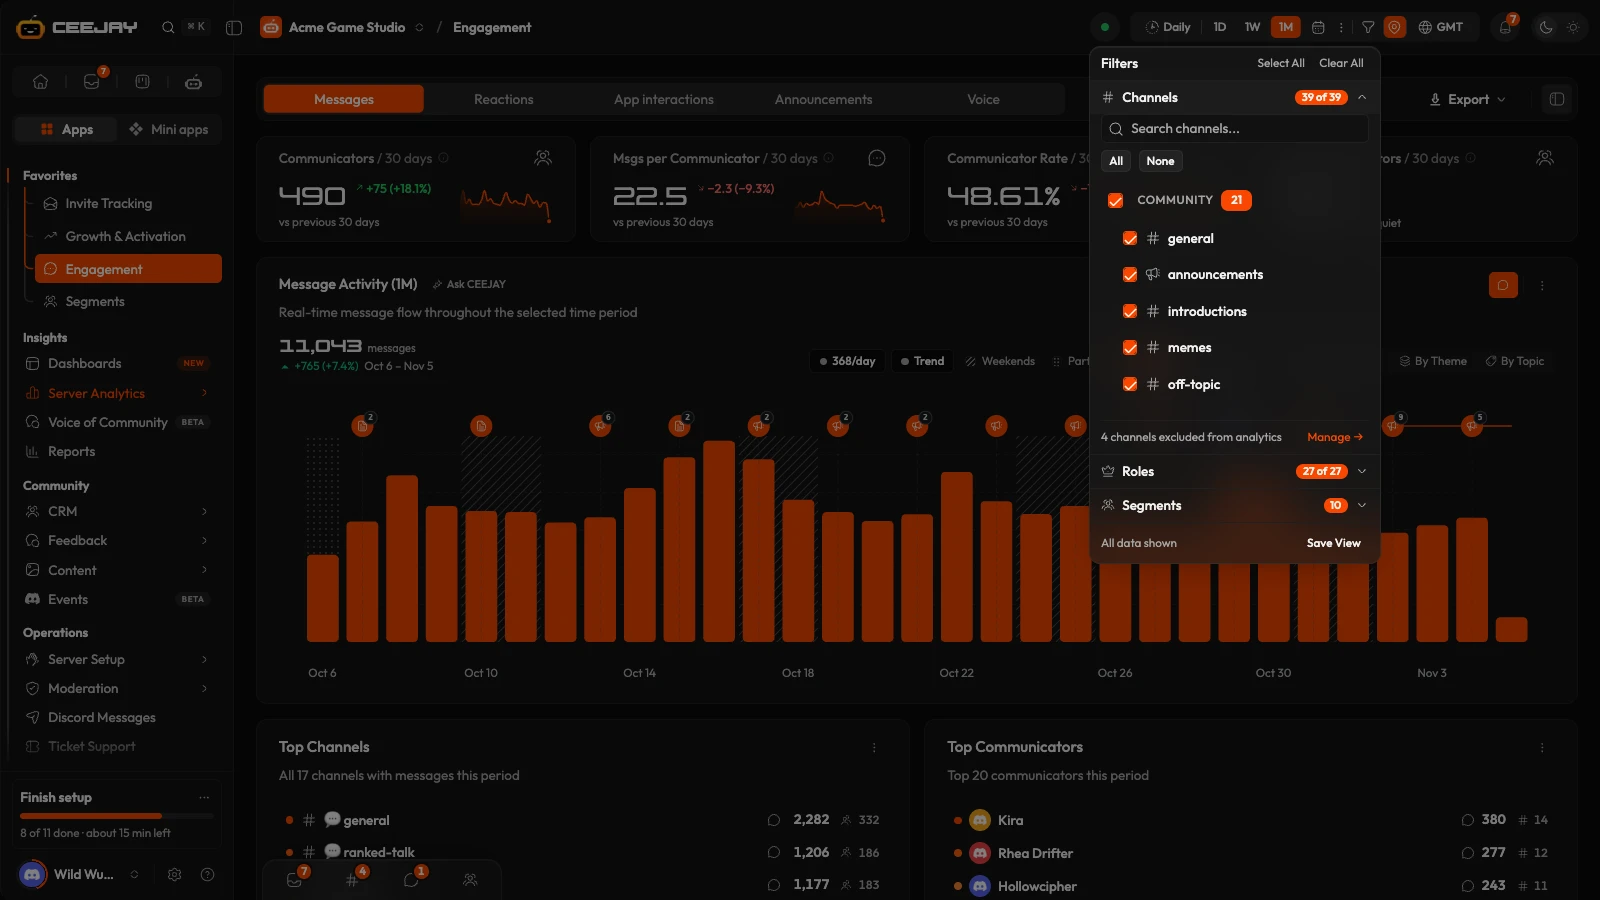
Things to know:
- The channel filter limits the numbers to messages and voice time in those channels. The role filter limits them to members who hold those roles.
- Roles and channels you exclude from analytics are listed under Excluded from analytics and left out of the message, voice and sentiment numbers. The daily figures on ROI still count them. Change this in Settings → Insights → Data & Tracking.
- The Segments list in the panel shows your segments and their size. It does not filter the page.
- Some numbers cannot be filtered. Activation, for one, shows "Not available with filters on". Joins and leaves on Growth belong to no channel, so the channel filter does not change them, and Announcements ignores the role filter. A page that cannot take filters has no funnel icon.
Show times in your timezone
The timezone button lists your local timezone, UTC and any zones you have pinned, then every zone by region. Search by city or abbreviation, and pin a zone with its pin icon so it stays in Quick select.
The choice changes how times appear in charts and in the heatmap, and the dates in CSV exports. Views that show "UTC" on the page stay in UTC.
Event markers
The map pin shows or hides markers on charts: Custom Event, Announcement, Poll, Giveaway, Survey/Form and Discord Event. Tick the kinds you want, or All Events. A marker is a badge on the chart on the day something happened, with the icon of its kind. Your server's own picture marks custom events your team created. Hover a marker for the title and date, and you can see whether a poll or an announcement lines up with a rise or a dip. When several events fall on one day, the marker shows a count, and pressing it fans them out above the day so each can be opened.
Keep a page live
The Live control opens a panel with a Live updates switch. While it is on, the page refreshes as new data arrives. The panel shows the status (Live, Connecting, Reconnecting, Offline, Auto-refresh or Paused), when the page was Last updated, and the Last event. Refresh now fetches the page again.
If instant updates are not available, the status reads Auto-refresh and the page still refreshes on a timer.
Read a chart
Every chart over time works the same way:
- Hover to see a dot on the line or bar you are on, and a tooltip with the date and each value. The line lights up around the point.
- Drag across the chart to select a date range. A panel shows its first and last dates, where each series started and ended, and the change. Let go to go back to the whole range.
- Weekends are striped on daily charts, with a Weekends key beside the chart, so you can tell a weekend dip from a real drop.
- Part day marks the first day of a rolling range when it is only partly counted. For example "last 7 days" at 20:31 starts at 20:31, so that day's bar looks short. It is not a real drop.
- Show values in the chart's ⋯ menu prints the number on each bar, or beside each point on a line. It is off by default, and your choice is remembered for you on that chart.
- Right-click a chart for its menu. On Server Growth and Message Activity it includes Comment on this point.
Chart menus
Most charts have a ⋮ menu (Chart options). What it offers depends on the chart:
- Chart Type: area, line or bar.
- Time Period: a range for this chart only. Use Global goes back to the header.
- Interval, Compare and Event Markers, each for this chart only. Reset to global undoes them.
- Show values: print the numbers on the chart.
- Max Items: how many rows a list shows.
- Export: CSV, PNG (Dark) or PNG (Light) of that chart.
A chart with its own setting shows a small chip beside its title. Press the chip to remove the setting.
Export a page
On pages with an Export menu in their bar, choose Export CSV or Export PDF.
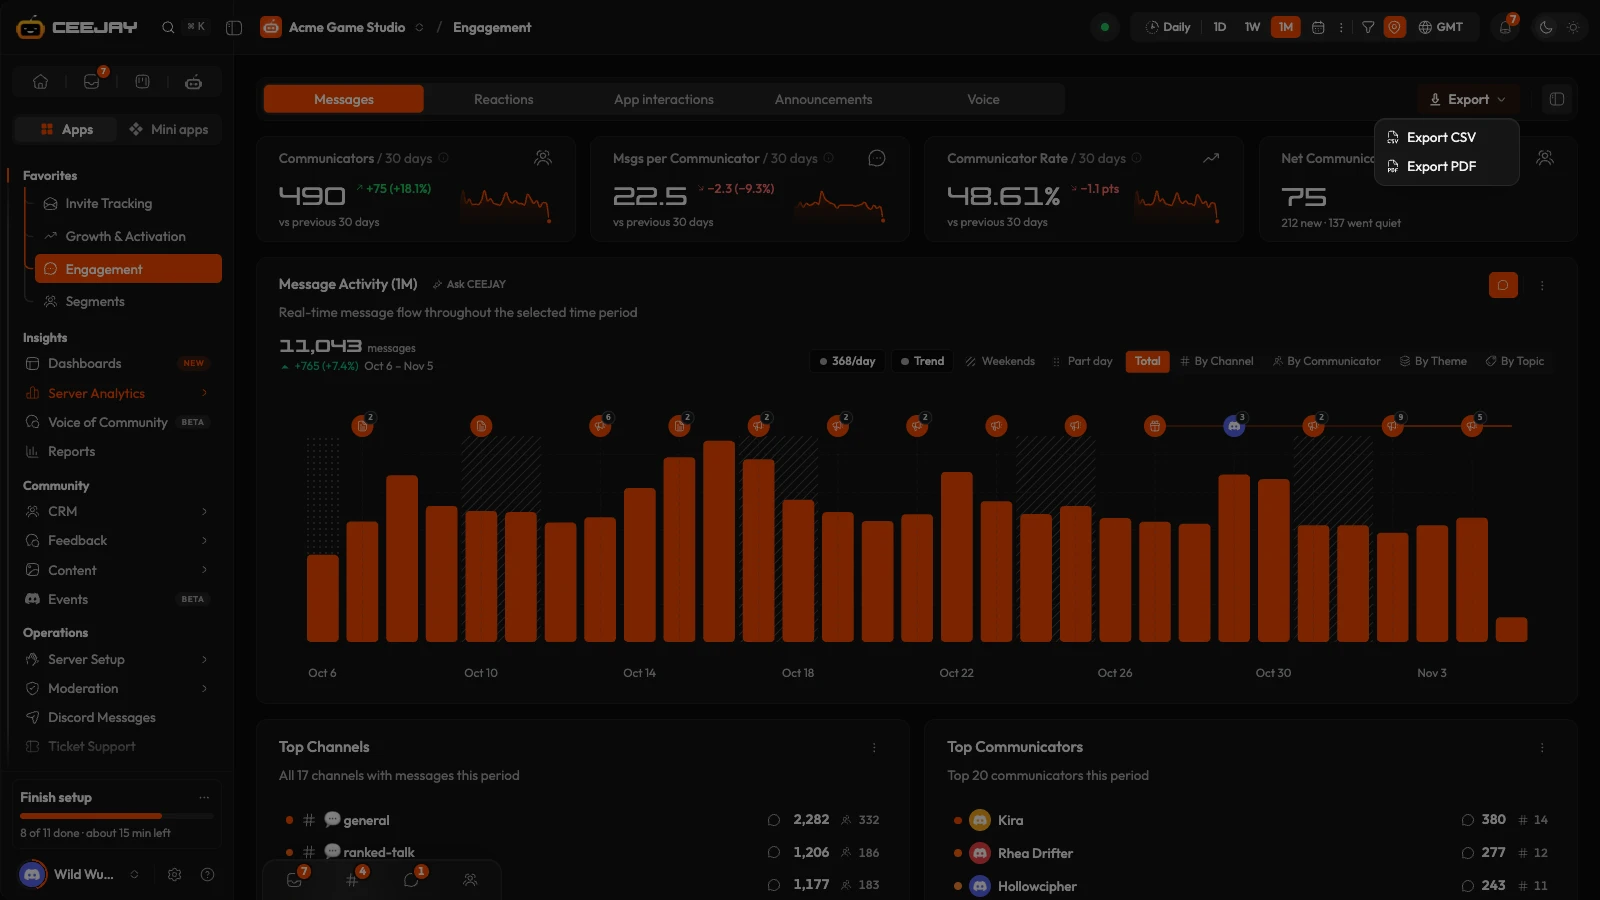
- Export CSV downloads one file with labelled sections for the page's main numbers and lists, for the range and filters on screen. Dates come in two columns, UTC and your display timezone.
- Export PDF builds a PDF report for the range you picked. The button reads Exporting… while it works.
Good to know
The page-level Export CSV covers Growth, Engagement, Voice of Community and Announcements. On Roles & Channels, Demographics and Activity, use the export menus on their tables, lists and charts. The PDF report is built for the quick ranges 1D to 1Y on Growth, Engagement, Voice of Community and Activity. On any other page, or on WTD, MTD, custom dates, a quarter or ALL, the export can take about a minute and then saves a picture of the page instead. Pick one of the quick ranges first if you want the report.

